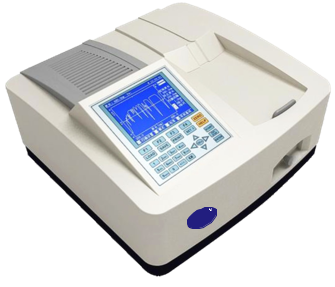
Double Beam Spectrophotometer LI-2600
Â
Â
Applications
Â
* Medicine/Pharmaceutical Industry
* Environment Monitoring
* Commodity Inspection
* Food Inspection
* Agricultural Chemistry
* Teaching in Colleges & Universities
* Metallurgy
* Geology
* Machine Manufacturing
* Petrochemical Industries
* Water and Waste water Labs
* Food and beverages Labs
Double Beam UV/VIS Spectrophotometer
Spectrophotometer is double beam optical system can restrain drift, compensates for blank changes, Suitable for long time test. It is simple to get a curve by using your standard with single or dual WL. It have wavelength scanning function using PC software. It is widely used in colleges and QC labs.
Â
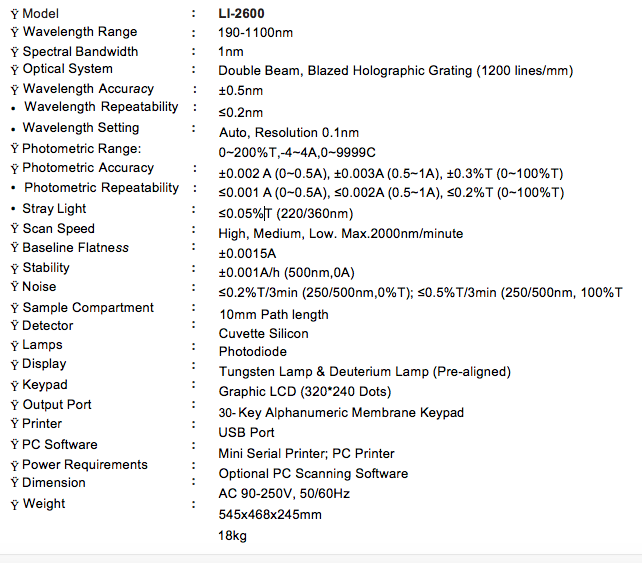
Technical specifications
Â
Â
 |
 |
Â
SALIENT FEATURES
Â
- Double beam optical system Low noise and Low stray light
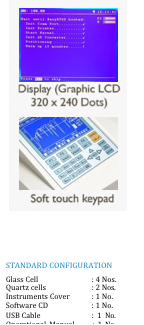
- Large LCD display, can display curve High quality grating, detector and lamps Data and Curve can be stored in real-time Auto setting WL, auto Blank
- Lamps can be turned on/off individually Easy to change Pre-aligned lamps
- Reinforced baseboard and bracket assures durability
Function:
- Photometric: T%, Abs
- Quantitative: Standard Curve System
- Utility
- WL Scan (Spectrum Scan)
- Time Scan (Kinetics)
- DNA/Protein Test
Basic Mode
Â
· Coefficient Method
· Standard Curve Up to 10 Standard sample may be used to establish a curve. Four methods for fitting a curve through the calibration points
· Linear t. Linear t through zero, Square t and cubic t.
DNA/Protein Test
Concentration and DNA purity are quickly and easily calculated: Absorbance rations: 260 nm / 280 nm with optional subtracted absorbance at 320 nm. DNA concentration = 62.9XA260-36.0XA280 Protein concentration = 1552xA260- 757.3xA 280
Â
Wavelength Scan
The wavelength scan intervals are 0.1,0.2,0.5,1,2,5 nm
High, Medium and low scan speed are available. They vary from 100 to 3600 nm/min
Wavelength are scanned from high to low so that the instrument waits at high WL. And it minimizes the degradation of UV sensitive samples.
Â
Kinetics
Abs vs time graphs is displayed on the screen in real time wait time and measurement time up to 12 hours may be entered with time interval of 0.5,1,2,5,10,30 seconds and one min. Post-run manipulation includes re-scaling, curve tracking and selection of the part of the curve required for rate calculation. Rate is calculated using a linear regression algorithm before multiplying be the entered factor.
1.